Does your team have the critical supply chain reports necessary to optimize inventory?
Picture this, Supply Chain Leaders: your site just received a mandate from your corporate office to reduce inventory this year by 10% across the board. Now it's time to scramble to develop and implement a strategy to optimize inventory. But where do you start?!
Does this situation sound familiar to you? At LeanDNA, we see this all the time. Based on our experience, we’ve compiled a summary of the four must-have reports that can help you quickly organize and attack any inventory reduction initiative.
Optimize inventory with these critical materials report
Report #1 - Inventory Projection and Line of Balance
What is the Inventory Projection and Line of Balance Report?
This report will help you address the question, “What is my inventory level for all items today and what will it be every week for the next 3 months? 6 months? 1 year?”
When you begin building your inventory reduction strategy, it’s important to understand the current state in order to craft an effective and meaningful plan.
In order to build this report, you need to know the current inventory value today as well as your future demand and supply for each item.
- Demand will typically include requirements driven from Work Orders, Sales Orders, and any Forecasted Usage.
- Supply should include all firm POs. If you have short lead times, you can also include Planned POs or Purchase Requisitions as incoming supply.
It’s important to perform this analysis at the item level so that you can filter and aggregate the information as needed.
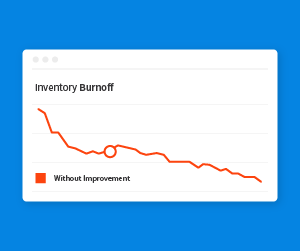 This report is typically presented as a graph of weekly data points. Ideally, you have historical information to show the inventory trend over the last 3 months, 6 months, or 1 year, as well as the future inventory projection. This will help you identify any seasonality or other trends in your inventory over time.
For more granular detail by part number, this data can also be presented as a Line of Balance either week-by-week or month-by-month. An extra benefit of this report is that it helps you prioritize current and potential shortages by week or month. Reducing inventory should never drive an increase in shortages if you also introduce a shortage management standard work process built around a standard inventory Line of Balance.
If possible, it’s helpful to include filtering ability in your Inventory Projection and Line of Balance report by Supplier, Buyer, Product Line, Commodity, or any other segment meaningful to your business. This lets you slice information to uncover differences in the inventory profile for different data segments. For example, one product line’s inventory level may already be optimized, while another has gone through significant customer demand changes. This report allows you and your team to hone in on which areas need the most attention.
Tactical Usage -- Why are these supply chain reports important and how will I use them?
This report communicates the current inventory projection to any interested stakeholders. You can also use this report to present status to executives or communicate issues to your supply chain team. If your goal is 10% inventory reduction and your current projection doesn’t achieve this result, you know it’s time to get to work!
As you begin the inventory reduction journey, you’ll want to refresh this report as often as possible so you can track progress. Again, it’s great to keep the historical snapshots so you can benchmark your progress and see how you’ve improved week-over-week.
Expected Results or Outcomes -- How will this help me achieve my goals?
The Inventory Projection and Line of Balance report allows you to clearly communicate whether or not you are on track to reduce inventory. And if there is a problem that needs to be addressed, you’ll know. Based on this first step, you’ll be able to fully articulate exactly how much inventory you need to reduce and how your current state will (or will not) get to where you need to be.
Once you understand the current state, you’re going to want to figure out how to improve so you can hit your inventory reduction goals. Or in a best-case scenario, this report will show that you are already going to hit your goals. In that case, congratulations!
Report #2 - Optimize Inventory with Plan for Every Part (PFEP)
What is the Inventory Opportunity Analysis and Plan for Every Part (PFEP) report?
This report will help you to answer the question “what is the plan for every part?” by creating a prioritized Plan for Every Part (PFEP). From here, you will determine:
- What order policy should we use for each class of items?
- How should we size these policies to maintain the optimal level of inventory?
- How will these changes affect my inventory if implemented?
A Plan for Every Part or PFEP is a common phrase among supply chain professionals. Determining a comprehensive inventory strategy begins with understanding what the PFEP looks like for your business.
Performing a PFEP allows you to create distinct buckets of inventory with ordering and replenishment policies aligned to key characteristics of each item. This alignment allows you to target an optimal level of on-hand stock for every item at any given time. To do a PFEP analysis, you’ll need to perform a few basic steps.
- Perform an ABC Analysis or ABC/XYZ Analysis
- Determine ordering strategy using basic rules for different buckets of inventory based on your business
- Use the ABC analysis and basic rules to set correct order policies and order sizes for each item
Step 1
To determine a baseline from which to begin the analysis, you will need to perform an ABC analysis to rank your items. This type of analysis help you segment your runners (e.g. high, steady usage) from your strangers (e.g. low, sporadic usage). Ideally, you should incorporate cost, lead time, and demand stability.
One straightforward way to perform an ABC analysis is to compare items based on Unit Cost * Daily Usage. This gives you a value of Cost per Day, which is a normalized way to compare different kinds of items in a single bucket.
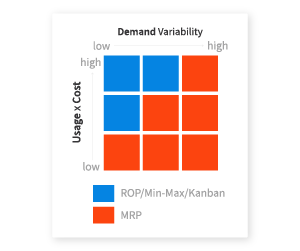 After conducting your ABC analysis, map your parts against Demand Variability. A or B items with relatively stable demand are good candidates for a MinMax, ReOrder Point, or Kanban (pull-based) replenishment policies. C items or items with a high degree of demand variability are good candidates for MRP-based replenishment policies.
Your ABC analysis determines which items to focus on. Because A items contribute to the majority of your inventory on a daily basis, focus on sizing these items first. Then, move on to the rest.
Step 2
After analyzing and ranking your items, you need to come up with some basic rules for how to configure item order policies and “tune” your ERP system. How you come up with the rules can depend on your suppliers or your ERP system. Are your suppliers willing to support a VMI MinMax system? Or does your ERP support MRP-based order suggestions -- e.g. Purchase Requisitions or Planned POs based on a particular Order Interval or Fixed Order Quantity?
Here are some common examples:
- Start with a simple rule like “All A items will be set to a MRP-based fixed order interval of 2 weeks, B items will be set to a fixed order interval of 4 weeks, and C items will be set to a fixed order interval of 12 weeks.”
- “All A items will be replenished using a fixed Reorder Point and Reorder Quantity along with a Safety Stock. B and C items will be ordered as needed via MRP Planned Orders based on a Minimum Order Quantity (MOQ).”
Step 3
Once the replenishment strategy has been established, the PFEP Report can help you size the policies.- For example, how big should your reorder quantities be? Or how large should my ERP order interval be? PFEP will tell you what changes need to be made in your ERP system to bring your settings into alignment with your strategy.
Tactical Usage -- Why is this report important and how will I use it?
The PFEP report is used to rank items and then provide your team with an easy summary of changes that need to be made to the settings in your ERP system. Ideally, this report can be generated on a regular basis to flag top inventory drivers that need policy adjustments. It’s bad practice to constantly adjust your replenishment and ordering parameters for all your items, but you also don’t want too much time to go by between reports. If an item has the wrong policy or an incorrect sizing for too long, it could lead to unnecessarily inflated inventory!
The best practice is to run the report periodically (e.g. monthly or quarterly). From there, let the supply chain team members who own the policy settings make the necessary adjustments starting with the A items first. This ensures that your order policies and replenishment settings stay in line with your strategy as demand or any other business conditions change.
Expected Results or Outcomes -- How will this help me achieve my goals?
A standard PFEP process helps you stay on top of adjustments that need to be made as a result of changes in your business. These could include changes in pricing, customer orders, production capacity, and more.
In any manufacturing environment, things are constantly changing. You cannot set ERP replenishment settings once and then forget about it. That will certainly result in too much inventory! Remember to rerun your PFEP periodically since changes in your business, your customers, or your factories can change your plans. It’s helpful to tie in this report with your SIOP cycle to make sure changes flow throughout your supply chain.
Your PFEP process will identify gaps and flag the most important and impactful things that your team can do to improve your procurement strategy and allow you to reduce inventory effectively.
Report #3 - POs Where you Need to Take Action (Cancel, Split, Push Out)
What is the POs to Action Report?
This report will help you address the question, “Is my supply aligned with my demand?”
Once you’ve set the correct ordering and replenishment policies for your purchased items, you are ready to burn off the extra inventory. To do that, you first need to ensure you’re preventing excess supply. It’s critical that you address all currently-scheduled supply orders (POs, Transfer Orders, Distribution Orders, etc) so that they’re in alignment with your policies and current demand.
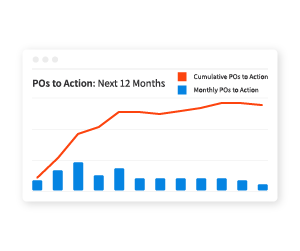 You need a report that prioritizes which POs to work first. Ideally, there is some logic in the report to help prioritize the actions which will have the most financial impact (e.g. Next 90 Days, Next 6 Months, Next 12 Months).
This seems obvious! You’re probably thinking of course we need to align supply with demand and buy the right stuff at the right time. Most supply chain teams have some form of MRP exception reporting that they use. This is standard blocking and tackling for a procurement team. BUT, where you start to see real benefits is if you can come up with a way to:
- Prioritize the Actions to Take, and
- Monitor the Progress of Completing the Actions to ensure the most valuable actions are being worked first (and actually completed).
It’s easy to dump an exception report out of your ERP system but that will simply overwhelm your team. Try prioritizing all A-class items first and paretoing the information by Supplier to determine buckets of actions to take.
It’s also very important to refresh the data often and come up with a way to track progress and ownership of the actions. It’s difficult to manage and track the ownership, status, and priority of the most critical POs to action (push out, split, or cancel) in a tool like excel. You may want to consider a tool with a collaborative workflow engine built-in to support this type of process.
Tactical Usage -- Why is this report important and how will I use it?
The prioritized PO Exception report should be used daily to help you ensure that POs are lined up properly with your demand and forecast. It’s ideal to determine a logical prioritization methodology (e.g. based on Item Class, $ impact in a certain time frame, or supplier) to ensure the right priorities are being addressed on a daily basis.
Expected Results or Outcomes -- How will this help me achieve my goals?
Equipping your team with the tools and processes to manage supply according to demand will help you achieve the inventory burnoff that your order policies are designed to support. Since you’ve already reset the order policies in the previous report, any new supply coming in should be sized appropriately and minimizes the need to reduce inventory later.
Report #4 - Potential Inventory Projection Based on Reduction Opportunity (PFEP)
What is the Inventory Projection Based on the Reduction Opportunity Report?
This report will help you address the question, “What could my inventory be if I perform PFEP and Align Supply with Demand?”
Once you can project your future inventory, optimize your replenishment strategies, and establish an effective process for managing the alignment of supply with demand, you’ll want to know:
- How long will it take to realize the savings?
- How can I set realistic inventory reduction expectations for my executive team?
To effectively predict what inventory reduction you can achieve over a specific period of time, it’s important to generate a new potential inventory projection. What could your inventory value be if you hit all your item-specific targets and take all necessary actions?
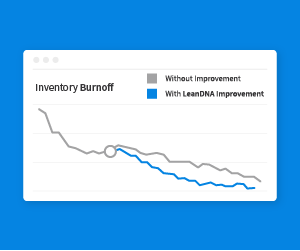 A Potential Inventory Projection report and graph requires you to set inventory target levels. By performing the PFEP adjustments that you’ve already identified and making the necessary adjustments to order policies, you can determine when you can realistically expect to achieve a burn-off to the target levels.
To generate this type of reporting, you’ll need to build a set of algorithms that calculate the potential burn off by simulating the net effect of your PFEP and realignment of supply and demand every week. This is absolutely the most challenging report on this list and it’s something that will likely require a technology platform to achieve.
Tools that provide this type of reporting allow you to effectively predict where your inventory value will move over time based on actions taken. This is an extremely advanced form of maturity in supply chain, and will help your organization achieve great inventory reduction results. Ultimately, this report helps you make important strategic decisions and guides your inventory strategy on a quarterly and yearly basis.
Tactical Usage -- Why is this report important and how will I use it?
The Potential Inventory Projection report and graph can be used to visualize the inventory value over time including all of the improvements that can be made. This will help articulate a realistic inventory reduction to your management team. Plus, it helps you understand the value of the remaining opportunity and open inventory actions.
Expected Results or Outcomes -- How will this help me optimize inventory?
Want to take control of your inventory projection and have more confidence in your committed reduction numbers? The Potential Inventory Projection does just that. Analytical tools like LeanDNA can help you generate this type of projection using purpose-built algorithms along with pre-designed workflows to make it easy for your supply chain team to reduce inventory.
Manufacturers that are able to project potential inventory can see increases in inventory turns of more than 200%. Those are big savings!
Key Considerations for critical materials report
When deciding how to create these four key reports, with a goal to optimize inventory, be aware of a few important things.
- To help ensure the validity of the data on an ongoing basis, make sure that these reports are refreshed daily. Otherwise, your data becomes stagnant and useless to your team.
- Make sure the information is easily accessible. A web-based tool or globally accessible collaborative platform is the way to go.
- Define standard work procedures for the team to follow with each of the reports. This ensures that all team members are working the same way to achieve the inventory reduction goal.
Whenever you need to quickly build an inventory reduction and shortage management strategy that works, these four reports are a great place to start and reduce inventory. Taken together, they help a supply chain organization understand its current state, identify top opportunities and predict success.
Optimize your supply chain reports to improve inventory turns by up to 30%.
Learn how you can start your digital transformation as quickly in as 6 weeks to optimize inventory with faster results
Are you considering transforming your inventory management techniques into smart factory practices?
Digital transformation for smart factories is necessary to build resilience in today’s increasingly complex supply chain. Learn more about how to build a smart factory and check out these frequently asked questions.
Driving team collaboration at Ingersoll Rand is no small task.
But Catherine Plumail was up to the task. Catherine knew that to drive a successful expansion a “one size fits all” approach wouldn’t cut it. Instead, she worked with her central team to pinpoint the current constraints for each site and how LeanDNA could best serve each team’s needs and find success in the global supply chain.
See how she drove supply chain alignment into their practices.
![[On Demand Webinar] Practical AI for Supply Chain Execution](https://www.leandna.com/wp-content/uploads/2026/04/Copy-of-Blog-Preview-Designs-27.png)