Your buyers do not have enough hours in the day. From managing shortages to finding inventory reduction opportunities, good time management is crucial. When dealing with thousands of parts and dozens of suppliers, your team needs a way to prioritize the items with the greatest overall impact on inventory cost. That’s where ABC analysis comes in.
What Is ABC Analysis?
Every single item we order does not have equal value. Some parts cost more. Some are used more frequently. Some are both. ABC inventory analysis helps categorize those items so we can understand which ones should receive our full attention.
As the name suggests, this inventory categorization technique groups your inventory in three buckets: A, B, & C.
- A’ items are the most important to an organization. This material should receive your full focus due to its high usage rate or a high price (or both).
- ‘B’ items have a lower dollar volume and are thus less important than ‘As’.
- Finally, ‘C’ items are the low rung on the ladder. Out of the three groups, you’ll have the highest number of ‘C’ items, but they will account for the lowest portion for your inventory value.
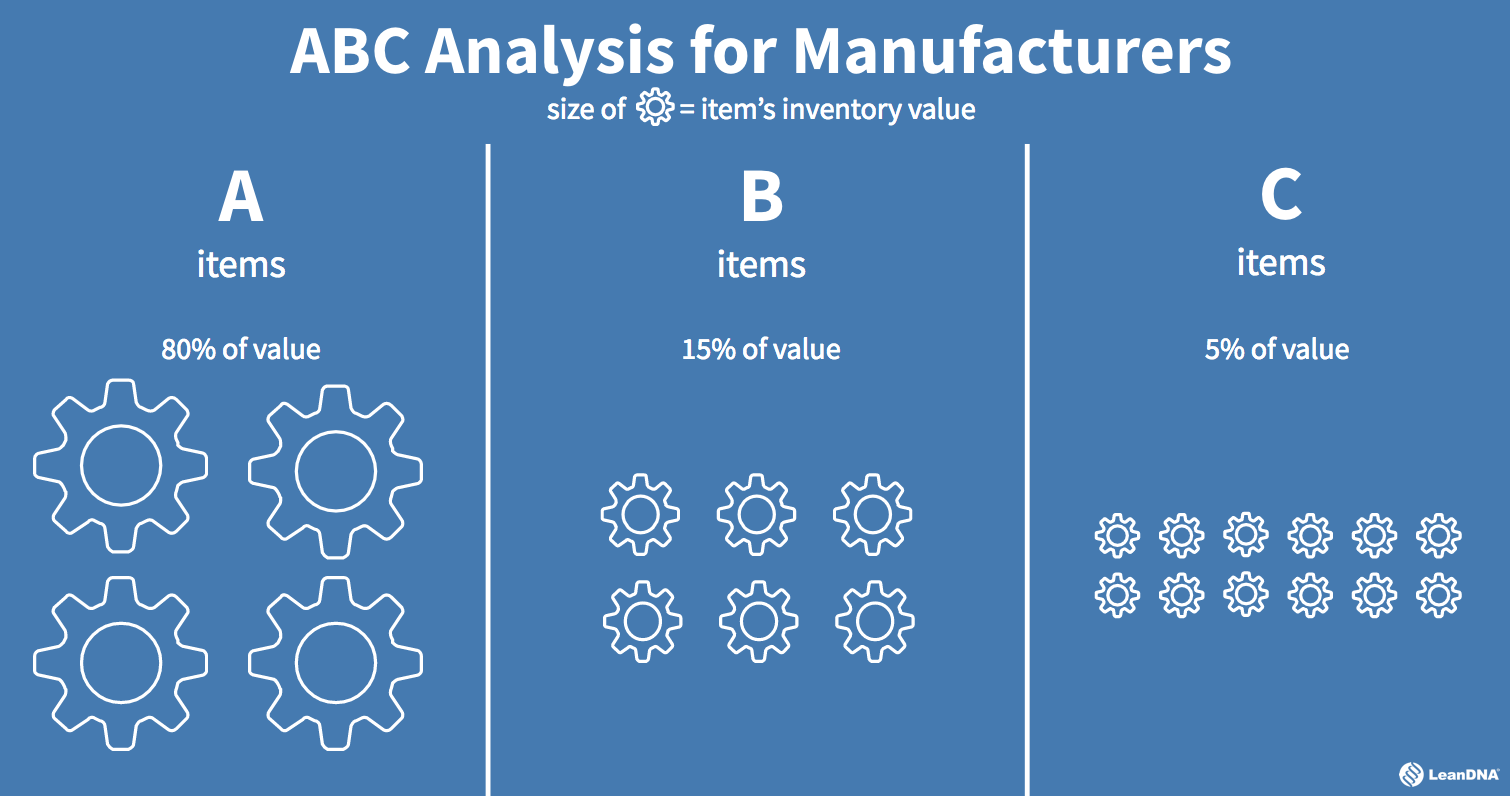
The Pareto Principle states that 80% of your inventory costs comes from just 20% of your inventory. This is known as the 80/20 rule and it helps shape the results of your ABC Analysis. LeanDNA recommends the following breakdown as the optimal way to determine the three categories:
- ‘A’ items – 80% of the annual inventory value of your items (likely made up of just 20% of your items)
- ‘B’ items – 15% of the annual inventory value of your items (likely made up of 30% of your items)
- ‘C’ items – 5% of the annual inventory value of your items (likely made up of 50% of your items)
ABC analysis has a lot of similarities to RRS analysis – “Runner, Repeater, Stranger analysis,” that is. Runners are your ‘A’ items, Repeaters are your ‘B’ items, and Strangers are your ‘C’ items.
In order to determine which parts fall into which categories, use the following steps:
- Determine inventory value by multiplying the price of an item by the consumption volume of that item in a year period. Simply put, item cost * annual consumption = inventory value.
- Repeat step 1 for all items to calculate total inventory value.
- Sort your parts from highest inventory value to lowest.
- Calculate each item's percentage of total inventory value. That item’s inventory value / sum of all inventory values = item % of total inventory value.
- Group the parts that account for the highest 80% of your total inventory and allocate them as ‘A’ items. Group the parts that account for the next 15% and allocate them as ‘B’ items. Group all remaining items as ‘C’.
Why Should Your Buyer Care?
 ABC analysis makes a buyer’s job easier. Let’s walk through a scenario that we've experienced many times in working with our clients.
Joe Smith is a buyer who is responsible for 1,000 different items. He receives dozens of messages each day from his ERP system for items that need to be pushed out, pulled in, and/or canceled. These messages get buried because he must constantly place new orders and chase shortages. By the time Friday rolls around, the messages have piled up. He now has over 100 different items to look at!
On his own, Joe may sludge through 80 items before he hits one that even makes a dent in the overall inventory cost. But armed with the wonderful knowledge of ABC Analysis, Joe can quickly prioritize which items he needs to look at first and which ones he can ignore if he doesn’t have time to get to them all.
When I tell Joe that it is better to spend time on 3 ‘A’ items than 300 ‘C’ items, it feels like he has hours magically added to his day.
What Happens When Your Buyers Use ABC Analysis?
When Joe learned of ABC Analysis, he obviously didn’t gain any extra work hours in the day. Something even better happened - he started using those hours more efficiently. Rather than just taking a shot in the dark to do work that impacts the business, he now holds more value and more time.
All thanks to ABC Analysis!
As I mentioned earlier, every single item ordered does not have equal value. It may not be the job of the buyers to conduct the analysis, but getting them to understand the value of ABC Analysis can be worth its weight in gold. Spend some time conducting ABC analysis at your company and see the positive impact it has on your inventory!
I’ve conducted an ABC analysis, now what?
After conducting your ABC analysis, the next step is to conduct an XYZ analysis. This will group the parts by demand variation levels. When the two reports are combined, supply chain teams can get a better picture of their inventory and therefore create an optimal Plan for Every Part.
Learn more about XYZ analysis best practices.
Automate your ABC-XYZ analysis with LeanDNA.
Creating an accurate ABC-XYZ analysis takes a lot of time and resources. LeanDNA uses historical data to automate this report to get you on the track to inventory optimization that much faster.
Learn how LeanDNA’s advanced plan for every part strategy can help you reach your goals