The ABC-XYZ Analysis
Buyers spend their days determining the optimal inventory levels that should be bought at any given time, but it’s not always a straightforward process. Without the right tools at their disposal, it can be incredibly tedious and time-consuming, often leaving buyers to rely on guesswork to guide their inventory actions. Beyond the ABC analysis, which helps categorize items depending on their value and importance, there is another process that is critical in maintaining optimal inventory levels—the XYZ analysis. The XYZ analysis provides an additional layer of statistical analysis that is essential to optimizing inventory levels to prevent as many shortages as possible while also minimizing the amount of inventory being carried.
What is an XYZ analysis?
An XYZ stock analysis is the complement to an ABC analysis, and adds a layer of statistical review that shows the standard deviation of usage. Other names for this analysis include Runners, Repeaters, or Strangers (RRS). The goal of this analysis is to understand which parts have steady usage and which parts have unpredictable demand so companies can make the best inventory decisions, successfully manage their shortages, and accurately determine order policies.
Using variations in demand, the XYZ model classifies goods as one of three categories:
- X Items: X items have very little demand variation. Demand can be reliably forecasted because it does not change as often or as drastically compared to other items.
- Y Items: Y items have fluctuating demand. The demand is typically due to a known or predictable cause, such as specific seasons, holidays, or changes in economic factors.
- Z Items: Z items have the highest demand variations. These variations are sporadic and unpredictable, caused by unknown factors or unusually strong changes in demand.
Based on these classifications, companies can use the demand forecast and XYZ material classification to determine optimal order schedules. X items should be ordered the most often—with low demand variation, buyers should be able to forecast demand accurately and place orders as often as daily. Y items should be ordered less frequently, keeping seasonal and other expected variations in mind. Lastly, Z items should be ordered the least frequently, as their demand levels are irregular and often unpredictable.
The output of these decisions will provide the factory with an optimized level of inventory; not too much working capital or carrying costs are tied up in the X parts at once since they are used consistently, while enough is invested in the Y and Z parts so that stocking out will be minimized.
How do you calculate the variability of demand for a product or inventory item?
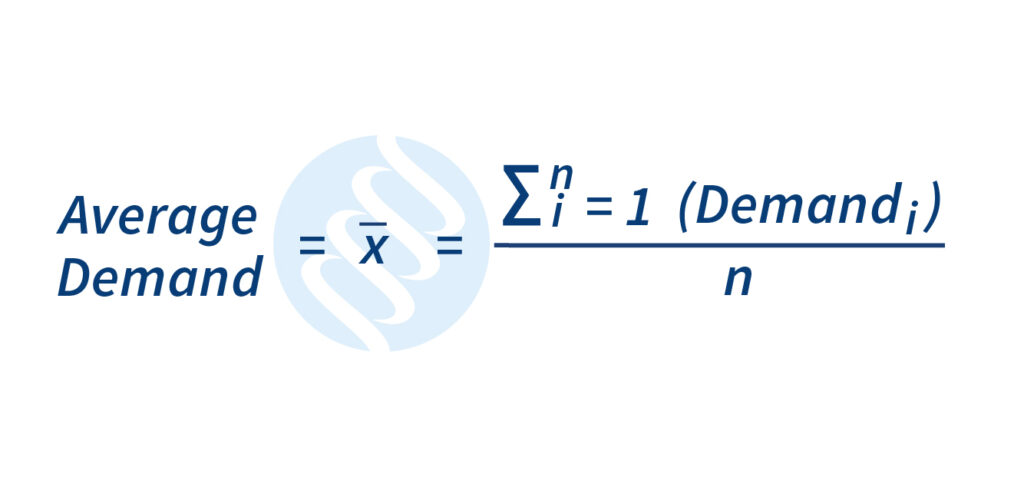
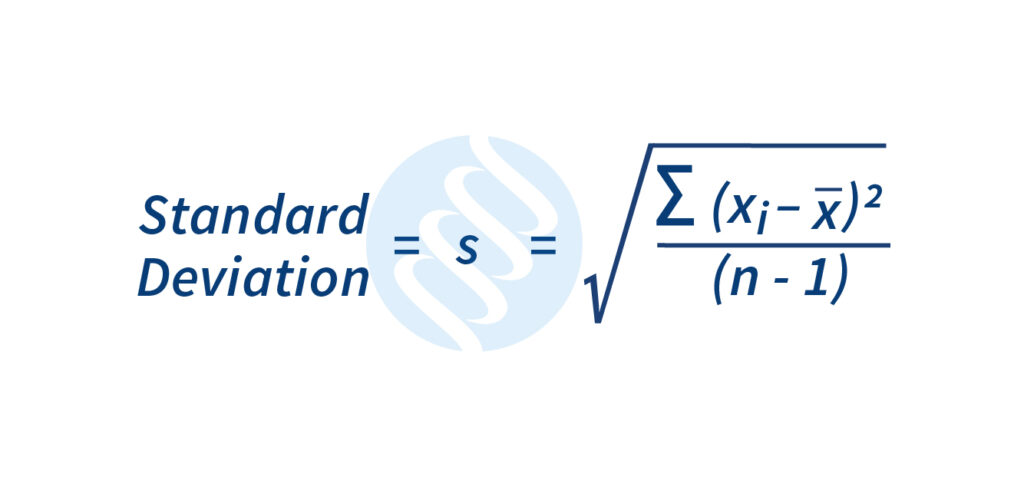
Demand variability is typically calculated by finding the average demand for a product over a certain period of time—this could be weeks, months, etc.—and then finding the difference between the demand at each data point and the average. Once this has been determined, each difference is squared and the average of the squared deviations is found. By then taking the square root of the average, it is possible to quantify the demand variability to be used in the analysis.
How does an XYZ analysis relate to an ABC analysis?
An ABC analysis and an XYZ analysis complement each other, and cannot be substituted for one another. Instead, they must be implemented together in order to provide the most value to a company. The main difference between the two is that an ABC analysis is typically a measure of throughput cost, while an XYZ analysis is based on the variances in consumer demand. Together, the two bring insight to each product item and how often each should be ordered to fulfill demand without overordering and creating excess inventory.
For example, a part that results in the classification of both A and X from an ABC-XYZ analysis means that it is a high-cost part with steady usage. Ideally, you would keep minimal stock of these types of parts and order frequently to minimize costs.
In contrast, a part that is classified as both a C and Z part means that it is both very cheap or low overall cost compared to your other items and has a higher demand variation. Purchasing a stock of these materials to be used when needed is ideal, as this part results in comparatively low working capital and carrying cost, but the demand for the part is unpredictable. This might result in more obsolete parts in the inventory, but is often a better strategy than missing customer deliveries and disposition of these materials over time.
Can I automate these analyses?
With the input of historical company data, LeanDNA automatically generates ABC-XYZ stock analysis reports as well as a full Plan for Every Part. Save time and money by swiftly and accurately determining ABC-XYZ classifications and putting them into action.
See how LeanDNA can work for you.

FAQ
What is an XYZ analysis?
An XYZ analysis divides items into three categories. X items have the lowest demand variability. Y items have a moderate amount of demand variability, usually because of a known factor. Z items have the highest demand variability and are therefore the hardest to forecast. Based on these categories, companies can determine how often they should order each item.
What is demand variability?
Demand variability is the level of change in a company or specific item’s demand. The greater the demand variability, the more demand fluctuates. It will be harder to forecast demand for an item with high demand variability than one with lower demand variability.
What is an ABC analysis?
An ABC analysis splits items into three categories based on usage rate and price. A items have either a high usage rate or a higher price (or both). B items have a lower price than A items. C items have the lowest usage rate and/or price, but will typically account for the highest number of items in your inventory, even though they are typically the lowest portion of the value of inventory on hand.
What is the objective of XYZ analysis?
The objective of the analysis is to understand the demand variability of the parts in a factory. This is done so supply chain teams can implement an additional layer of planning for these parts to better optimize inventory, resulting in lower on-hand and obsolete inventory value and fewer shortages. XYZ management adds significant value to inventory optimization strategies.
Put your XYZ analysis to good use.
ABC-XYZ analyses are great, put if they aren’t put into action, then they are useless. The reports you develop from this analysis should be used to create your PFEP, or Plan for Every Part.
Learn more about PFEP best practices.
Looking for the benefits of inventory optimization?
Look no further. See how Tony Gonzalez, the global lean supply chain manager at Electrical Components International (ECI), saw a reduction in critical shortages an average 30 percent across their sites in the first six months after implementing supply chain automation software.