Written by Richard Lebovitz and Adam Baker
If you have ever tried to “fix” safety stock in a spreadsheet and watched nothing change on the shop floor, this is for you. Inventory Optimization in APEX started exactly where many manufacturers stall: the math looked fine, but the results were inconsistent. So our team dug in, rebuilt the inputs, added a simulation engine to model and compare scenarios, and paired everything with clear projections that leaders can rally around. The outcome is a Plan for Every Part that analysts actually use and executives actually trust.
APEX by LeanDNA is AI-powered expert execution through a factory-first platform, enabling supply chain teams to execute with peak intelligence, precision, and domain knowledge. Inventory Optimization is where that philosophy becomes tangible for analysts and leaders.
The Problem We Set Out To Solve
Teams were telling us a familiar story. Safety stock formulas were too rigid. Order policies were one-size-fits-all. Demand variability and lead times were treated too simply. Exceptions couldn’t be handled in an automated way. So people would revert back to spreadsheets - exporting data to Excel and building macros - but they still couldn’t get a stable outcome across thousands of parts. Even customers who tried LeanDNA’s older PFEP settings often reverted to spreadsheets for flexibility. We listened, watched how power users were hacking around limitations, and got to work.
What Changed Inside APEX Inventory Optimization
Better inputs. We rebuilt core demand signals and variability so the safety stock calculation reflects reality rather than being driven by inaccurate demand inputs. We also treated long lead time parts differently than short lead time ones, which is how analysts already think.
Policies with range, not rigidity. Instead of picking a single method for every SKU, you can configure policies by segment and maturity. Analysts can treat stable A parts one way and intermittent C parts another, without gymnastics in Excel.
Overrides that capture tribal knowledge. Some realities never show up in raw data, like configured-to-order items where safety stock makes no sense. Explicit overrides preserve that context so optimizations remain grounded.
A real sandbox. Run as many simulations as you want without touching production. Compare scenarios, teach the team with live graphs, and only promote a strategy when you are confident. It removes the fear of changing the engine while the plane is flying.
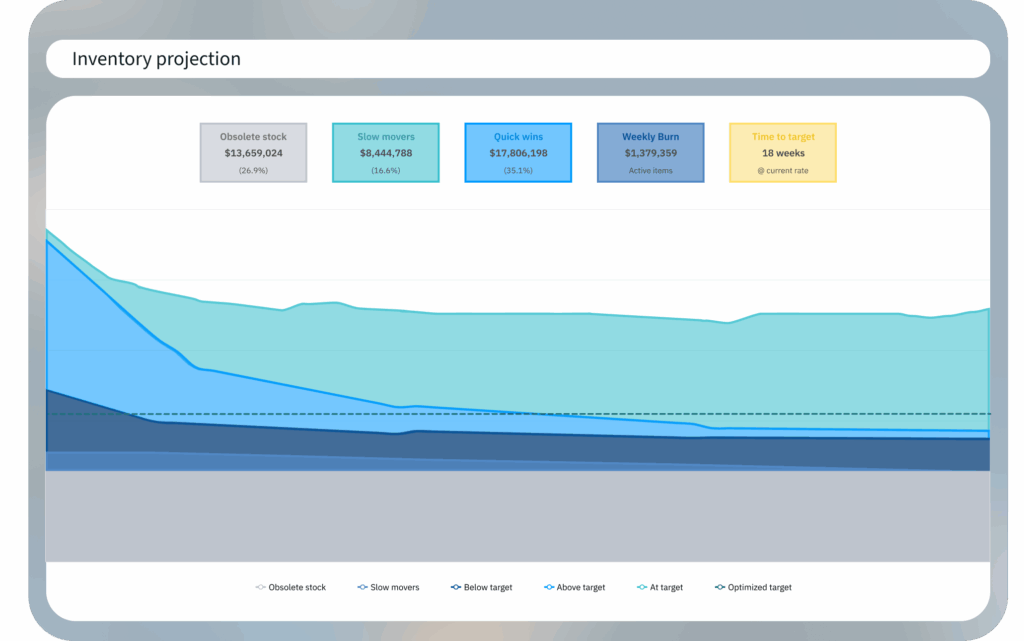
Clear projections that drive alignment. The new inventory projection and burnoff view makes targets visible and believable. Leaders see what is possible in the next few weeks, months, and the year, and teams can connect actions to outcomes.
Five Features Analysts Will Live In
1) PFEP Analysis
PFEP Analysis replaces tribal knowledge and spreadsheets with a consistent way to segment parts by throughput cost, demand profile, and stability. It also gives leaders a clear view of where inventory can come down. Slow movers, obsolete items, and quick win reductions become visible at a glance. This segmentation becomes the foundation for choosing the right replenishment strategy and for identifying where the biggest improvements sit.
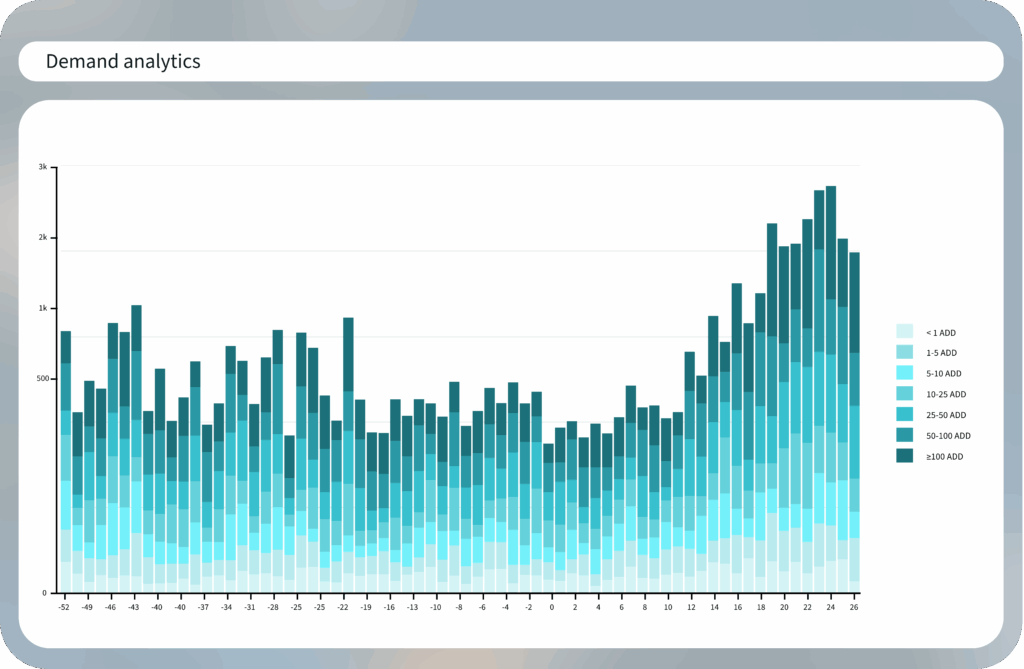
2) Demand Analytics
Demand Analytics gives analysts a clean, dependable view of demand by filtering out noise and stabilizing variability. It highlights the patterns that matter so replenishment decisions, safety stock sizing, and order policies are grounded in accurate signals rather than inconsistencies in raw data. This is the place to understand real demand behavior across thousands of parts and ensure the rest of Inventory Optimization is powered by a reliable foundation.
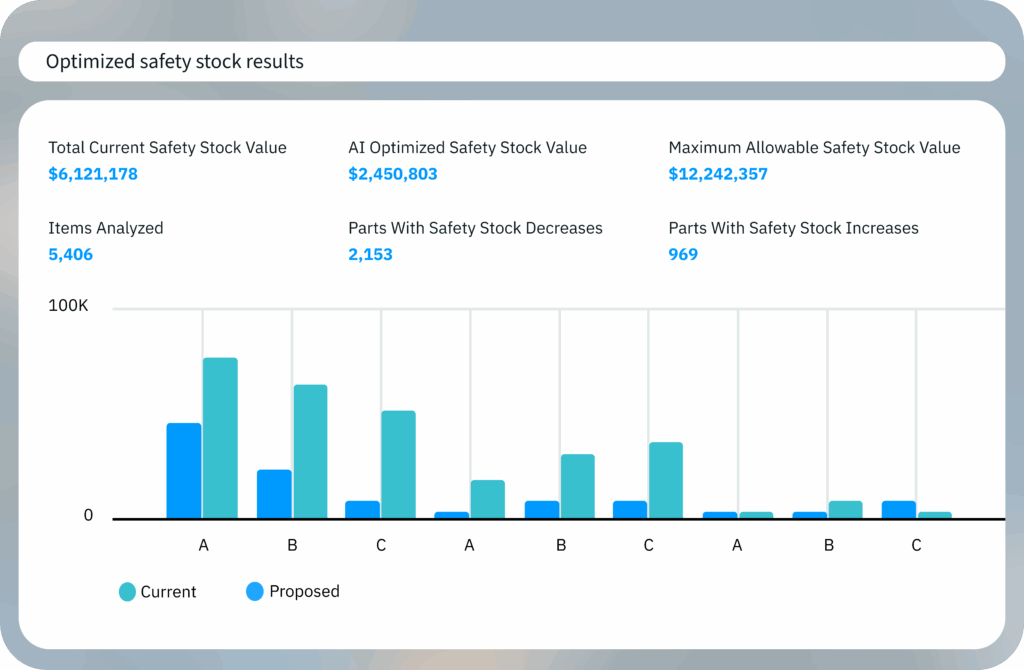
3) Safety Stock Optimization
Safety Stock Optimization sizes inventory with precision across every segment. Analysts can define service objectives, apply guardrails that fit their maturity, and tune safety stock by stability, lead time, or part classification. Existing decisions can be respected, new areas can be guided, and every part receives the level of coverage that aligns with performance goals. It brings structure and control to the safety stock process while keeping flexibility where it is needed.
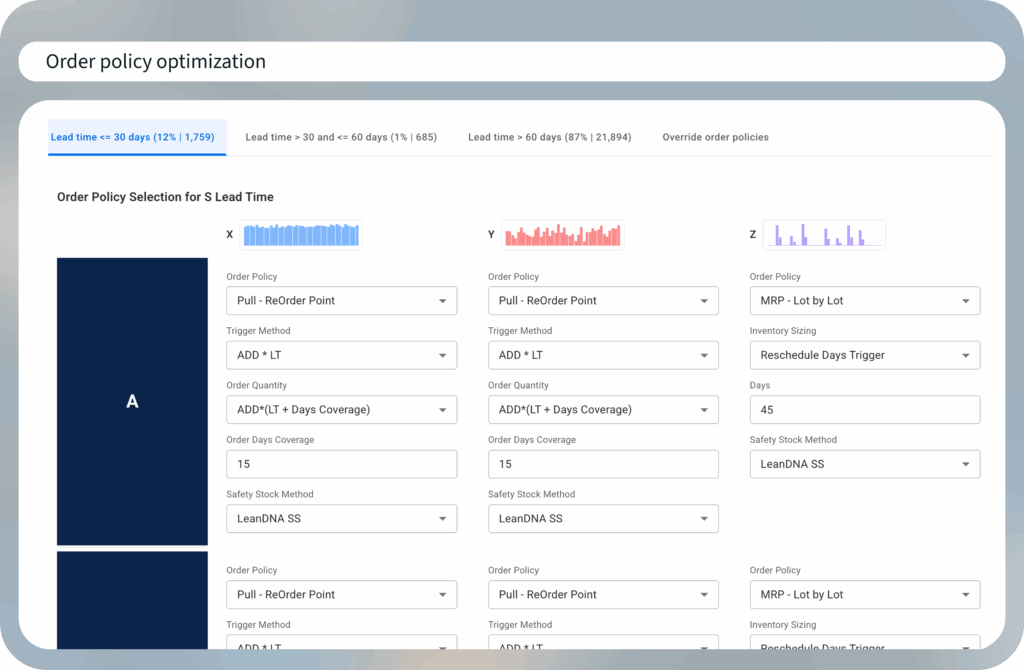
4) Order Policy Configuration
Order Policy Configuration centralizes the rules that drive execution. Order intervals, Min Max, reorder points, MRP logic, and the exceptions that never show up in raw data all live here. Overrides capture real world constraints so they are not lost when teams change. This tab gives analysts the flexibility they need and ensures sites follow policies consistently.
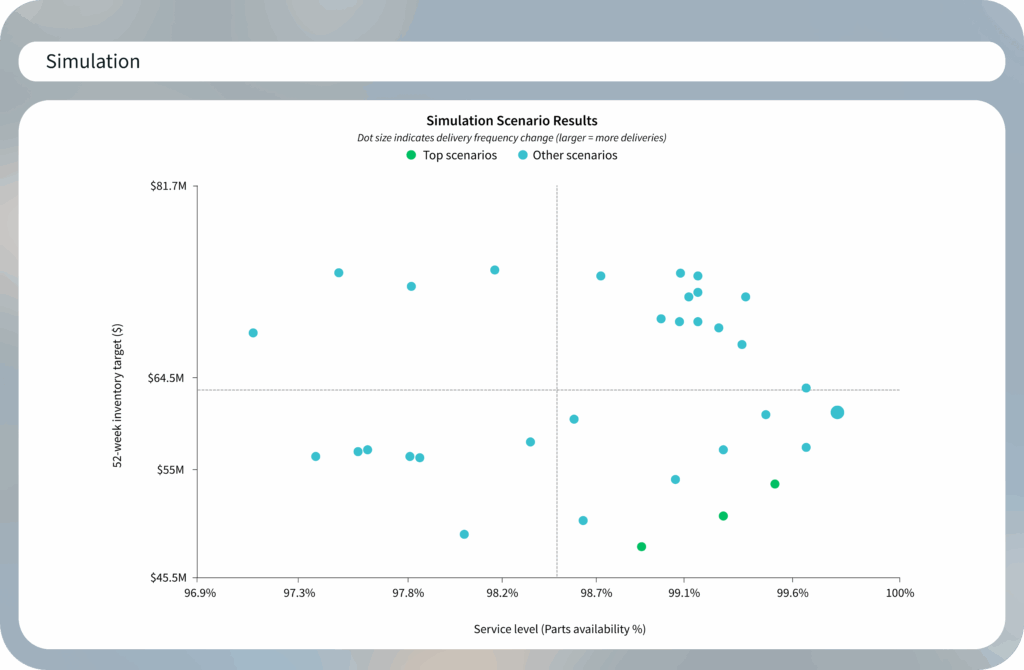
5) Simulation
Simulation is the breakthrough that changes how analysts work. Instead of testing changes in production and waiting overnight for results, analysts now have a true sandbox. They can create a baseline using current ERP policies, run scenarios, adjust assumptions, and compare outcomes quickly. It accelerates learning, removes hesitation, and gives leaders a clearer projection of what is achievable.
Why The Sandbox Matters More Than You Think
Prior to releasing the new Inventory Optimization capability, testing a new policy often meant running analytics and letting them process overnight, then hoping the change did not confuse day-to-day users. Now analysts can iterate quickly in a dedicated space, compare policy simulations side by side, and even start with a baseline that mirrors current ERP policies to understand impact before they resize anything. That workflow change lowers the barrier to entry and speeds up learning.
Inventory Optimization makes trade-offs visible. Increase order interval for a class of parts and watch how service levels and inventory respond. Tighten a demand band and see whether you are creating risk. Analysts can show stakeholders the options, the impacts, and the reasoning behind a chosen strategy. This is where the spreadsheet era breaks down and the platform starts to shine.
What Leaders Get That They Did Not Have Before
A projection you can manage to. The inventory projection replaces hopeful burnoff lines that never materialize with a more accurate view of where you will land if you work the plan. That makes incentives credible and trade-offs explicit.
A stronger foundation. Order policies are the house foundation of supply planning. If they are off, everything sticks and squeaks. With Inventory Optimization, analysts and executives build a solid foundation so buyers fight fewer fires and drive fewer manual corrections.
Measured, faster ROI. Customers using APEX capabilities see double-digit inventory reductions and fewer shortages when they pair optimization with execution. The platform delivers 14% lower inventory, 32% fewer shortages, and 18% better on-time delivery, which can be scaled across sites.
Hardest Pieces To Replicate Outside APEX
You could sketch a burnoff chart in Excel. The challenge is everything behind it. You need accurate demand classification, lead times, policy segmentation, safety stock math, and an execution loop that turns recommendations into actions. That is a platform problem, not a spreadsheet trick. The record-keeping for overrides, the PFEP matrix that stays consistent across sites, and the sandbox that respects data lineage are also difficult to sustain manually.
Where Inventory Optimization Sits In Your Stack
APEX provides the following capabilities across the value chain so you can move from raw data to optimized policies in one place:
- Data & AI Engine to centralize and harmonize multi-site ERP data and power insights
- Supply Insights for real-time supply-demand analysis and prioritization
- Procurement Management for recommended inventory actions and collaborative execution with buyers and suppliers
- Inventory Optimization for policy design, safety stock, and simulation
- Kei AI Assistant for answering questions and providing recommendations based on your site data, shortages, and inventory trends
It is all factory-first and designed to solve for the shortage-excess tug of war.
What A First-Class Analyst Workflow Looks Like
- Baseline the truth. Mirror current ERP policies in the sandbox and run the simulation to establish your starting point.
- Segment with PFEP. Classify parts by throughput cost and demand profile, then map them to sensible replenishment strategies.
- Resize with safety stock optimization. Target service and cost, then test across scenarios.
- Tune order policies. Adjust order intervals, Min-Max, or ROP by segment and lead time.
- Promote to execution. Push approved changes to your ERP and monitor buyer actions and performance in Workbench dashboards.
Think of APEX’s Workbench as “make today right”, and APEX Inventory Optimization as “make tomorrow better.” Run simulations in Inventory Optimization, promote the winning strategy, and buyers receive clearer, higher-value recommended actions in Workbench. What cannot be done today becomes input for the next optimization cycle. That flywheel is where performance compounding begins.
Final Word
The industry will always be volatile. Tariffs shift, lead times slip, and demand surprises you – that is not going away, but what can change is how your team responds. APEX Inventory Optimization trades fragile spreadsheets for an analyst-ready sandbox, gives leaders a projection they can manage to, and closes the loop with execution. Guesswork shrinks and inventory becomes a lever for performance, not a liability.
Across APEX customers, standardizing data, prioritizing actions, and optimizing policies produces measurable, time-bound outcomes. Think lower working capital, fewer expedites, better COTD, and faster onboarding for new team members. It is a practical way to turn supply planning into a durable advantage.
If you want to see how this fits into your multi-site reality, we can walk through the APEX platform and dive into the new Inventory Optimization capability in depth. We will simulate, size, and show the path to a number your CFO cares about.