Why Automation?
Advanced Inventory Reporting and Supply Chain Analysis Solutions
Your car’s dashboard features a broad array of controls, measures, and gauges. You can tell how fast you are going, how the car is performing, and when you are running out of gas. Everything you need to know is right there in front of you. Your supply chain analysis dashboard should be no different.
At LeanDNA, our built-in dashboards are comprised of widgets that provide critical insight into your most important metrics. With these highly customizable dashboards, users can make quick, informed decisions to improve factory performance.
While every widget brings value to the organization, these five are essential for procurement teams to standardize workflows and improve efficiency.
Click here to learn more about the standardized role-based workflows LeanDNA offers.
1. Inventory Action Summary
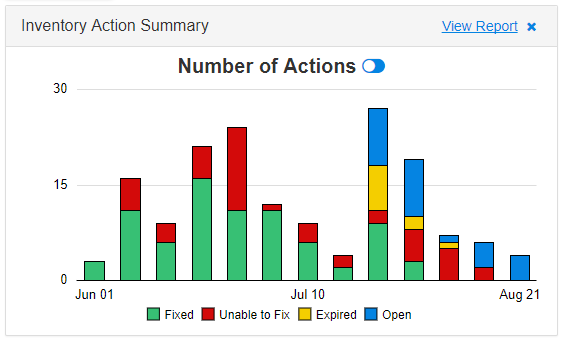 Buyers can log in to LeanDNA for daily automated recommendations for several specific actions to reduce their inventory. The Inventory Action Summary Widget shows your team’s real-time progress in completing these high-value actions. Click here to read more about the inventory optimization rules that you can also implement to rightsize your material levels.
This widget is awesome because you can see the tasks behind inventory reduction on a weekly basis. Everything your team has done to work towards lower costs is broken out here. Plus, you can view the data by the number of actions or the value of actions.
If you want to drill into which tasks were completed within a specific week, simply click on the colored bar for a full report.
2. Purchase Orders For Excess & Obsolete Inventory
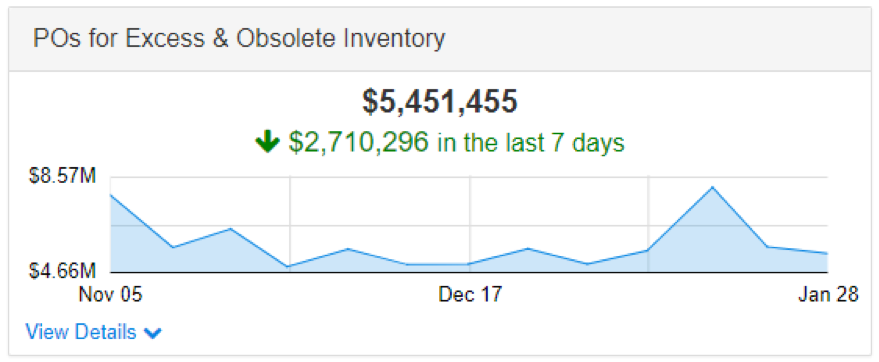 This widget shows the total open Purchase Orders (POs) for excess inventory by division, site, or even for an individual buyer. It’s a quick view of which POs can be cancelled or reduced to give you the most bang for your buck.
Most ERP systems will send you messages for unneeded POs, but it’s usually all or nothing. For example, if you have 0 demand for a part, but you have 10 parts on order, your system may tell you to cancel the order. But what if you have demand for 5 parts, but 10 parts on order? Your system may not send you a message, even though there’s room for improvement.
But this widget will alert you of both scenarios, so you can improves all types of POs. This will make sure that the PO will rise to the surface and addressed quickly.
3. Purchase Orders to Action Next 12 Months
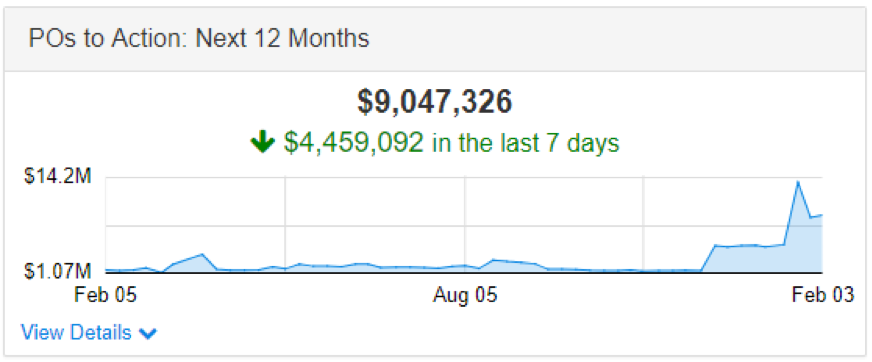 Let’s take the above example a step further. Perhaps a buyer or analyst would like to understand which items have POs within the next 12 months in excess of requirements within that same time frame. The POs to Action: Next 12 Months Widget projects the value of future purchase orders that you can either cancel or push out to avoid unnecessary inventory increases.
This gives buyers and procurement teams visibility into the potential excess that will be received in the future if no action is taken. This widget takes future requirements into account too, so it helps your inventory savings add up!
One really practical way to use this widget is to filter by Lead Time. This lets you view data for POs that are Outside Lead Time, which are easier to action. We recommend starting with these orders for some quick wins.
4. Purchase Requisitions Inside Lead Time
Think of the Purchase Requisitions Inside Lead Time widget as the low fuel light in your car. Just as the low fuel light warns you when you’re running out of gas, the PRs Inside Lead Time Widget warns you when you’re running out of parts and a shortage is imminent.
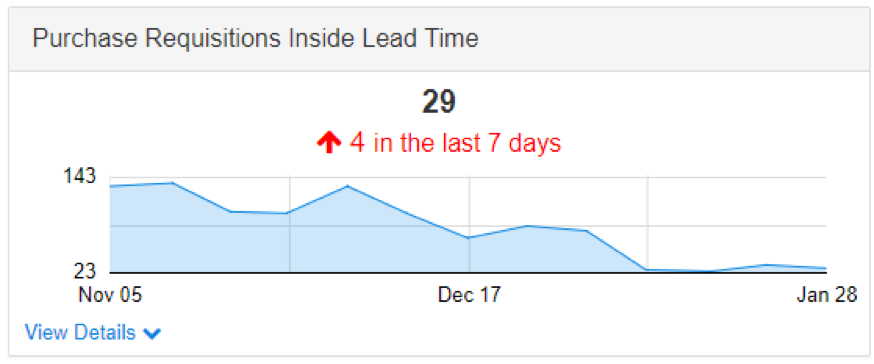
This widget shows the total number of PRs (or planned orders) that need to be firmed into actual POs by using your lead time to determine a date by which the PR needs to be firmed. Any dates that are in the past are highlighted in red. This means that purchase orders need to be firmed immediately or you are at risk for a shortage.
Not acting on items suggested to you by this widget is the equivalent of driving past the gas station with your tank on empty.
5. Open Purchase Orders Behind Schedule
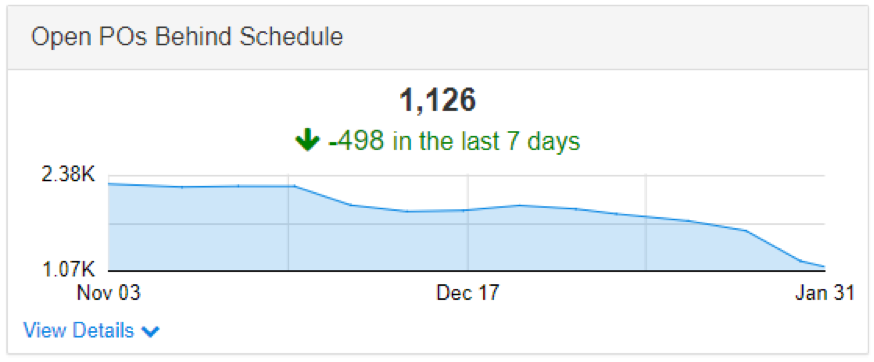 In a perfect world, your supplier would hit their delivery date 100% of the time. If that made you laugh, then you have been working in manufacturing for more than 10 seconds.
Unfortunately, late deliveries happen all the time. As a way to track these past due deliveries, LeanDNA created the Open POs Behind Schedule widget. This widget won’t magically cure late deliveries, but it does organize any late POs into one place. You don’t need to dig through numerous pages in your ERP to find which items to talk to your suppliers about.
Want Even More Supply Chain Analysis Solutions?
LeanDNA has an expansive offering to enhance current and incoming inventory reporting solutions to optimize your supply chain.
See more of LeanDNA's supply chain optimization command center >>
Digital transformation is shaking up inventory management.
Today, advanced management solutions are redefining success and shifting the center of control. Manufacturing companies are taking control back of their inventory operations with a renewed focus on the factory—the strategic epicenter for delivering on-time to customers and operationalizing efficiencies. At the core of this transformation–a complete digital shift.
LeanDNA has been featured as a best-of-breed solution by Supply Chain Insights.
Supply chain management is more complex than ever before and requires the oversight of a nonlinear, and often very unpredictable, system. The companies that are being held hostage to their ERP system are looking for new solutions to bridge the gaps and optimize the procurement process. By using best-of-breed solutions, business teams improve their ability to get to data by 15–20%.


